| |||||
|
Many facets considered.
Is it FOMO? Real? Fundamental? Group Think?
| |||||
Rates vs. Returns: An Expensive CoincidenceBy Max Wolff · 6-minute read
| |||||
|
In September the Fed hiked for the first time since 2023, and the blame slide is coming back. Four decades of vintage data say look somewhere else. | |||||
| |||||
| |||||
|
By the Numbers
| |||||
| |||||
|
The Usual Suspect Every limited partner (LP) deck has a slide blaming the Fed for a bad vintage. The data mostly disagrees. Rates are, at best, a supporting character. Pearson correlations between the prevailing interest rate in a fund’s vintage year (the year it starts investing) and its eventual IRR sit in the -0.44 to +0.36 range depending on stage and era (Cambridge Associates; PitchBook). That is how statistics spells “supporting character.” The Chart · The Coincidence Zone Across most venture capital (VC) cohorts, the interest rate in a fund’s vintage year shows little reliable relationship with its eventual IRR. | |||||
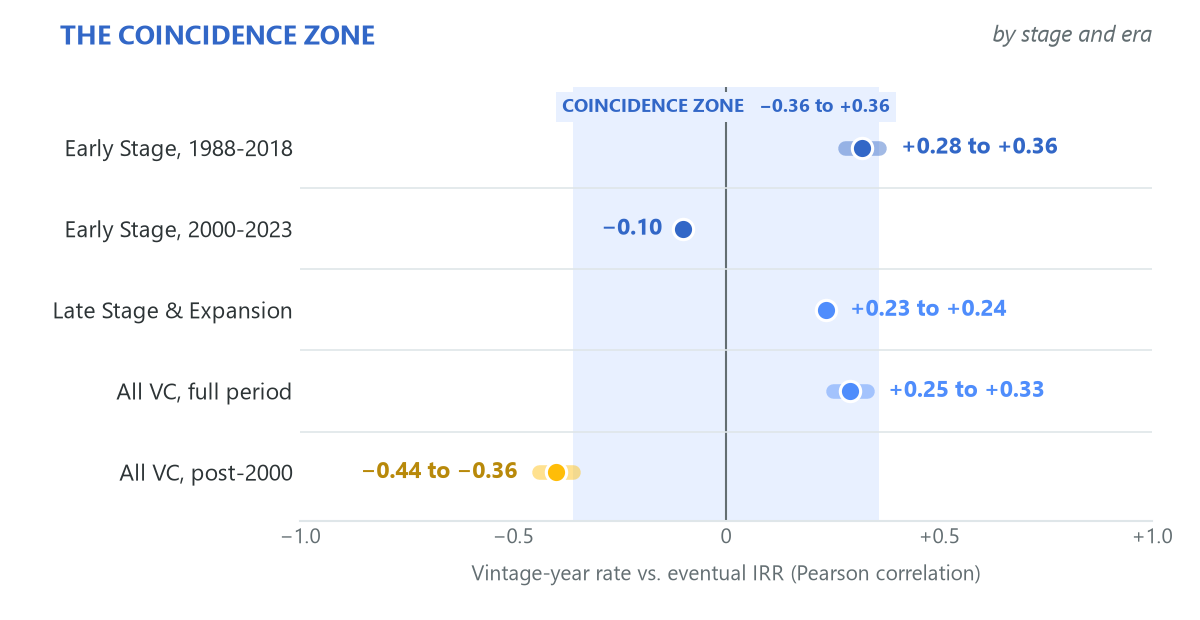
Pearson correlations on 24 to 31 annual observations. Source: Cambridge Associates; PitchBook.
| |||||
|
The chart is the receipts: correlations this weak mean rates and returns just don’t line up the way a Fed-blaming LP would want them to. What the data actually screams: 1996 was absurd, 1999-2002 was a bloodbath, and neither had much to do with what the Fed was doing that year. 1996’s 133% Early Stage IRR happened at a perfectly ordinary 5.3% fed funds rate. 0.08%
The 2021 vintage’s -3.2% Early Stage IRR happened at a 0.08% fed funds rate: essentially free money, and it still lost. The One Real Pattern Forget the rate level. The thing that actually predicts a vintage is whether everyone was already drunk on valuations when the fund started buying. Cohorts formed at a valuation peak get crushed almost regardless of stage: 1999-2000, 2007, 2018, 2021. Cohorts formed right after a rate-hiking shock reset the market tend to do well: 1990-91, 2002-03, 2009-2012, 2022-23, even at 0% rates, because they bought the discount (Neuberger Berman). The Map · What Sorted the Vintages Forty years of venture vintages, placed by the interest rate in the year each one formed. | |||||
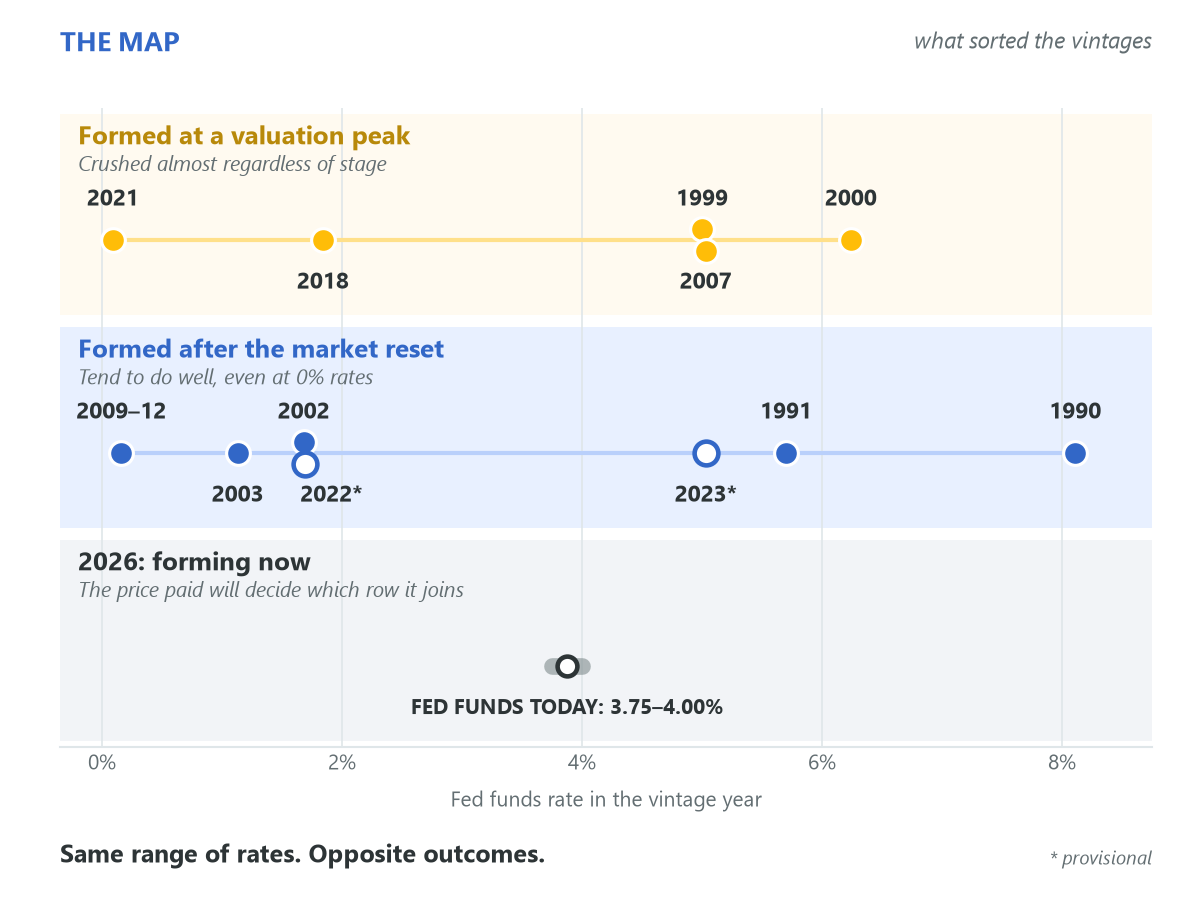
Fed funds rates are approximate annual averages. *2022–23 returns are still provisional. Source: Neuberger Berman; Federal Reserve.
| |||||
|
Which makes 2026 two vintages at once. AI takes almost 80% of venture deal value, while founders outside AI sign tougher terms (PitchBook). Same Fed. Two vintages.
Why Early Stage Shrugs and Growth Flinches Growth and late-stage deals get priced like grown-up companies: near-term cash flows, comparable multiples, the whole discounted-cash-flow apparatus that rising rates torch instantly. Early-stage bets are priced on vibes and a decade-long option-value thesis, so the rate on the day of the term sheet barely registers next to whatever’s happening at exit, eight years later (Neuberger Berman). | |||||
| |||||
|
That’s why the “All VC” blend gets meaningfully more rate-sensitive as the sample fills up with bigger, later-stage checks, while pure Early Stage keeps posting a correlation near zero across both datasets. Independent research backs this up. A Burgiss-based study of 1985-2023 US private equity found no significant correlation between annual returns and interest rates over the full period. The relationship only shows up in sub-periods, hitting -0.63 with the 10-year Treasury post-global financial crisis (GFC) (Neuberger Berman). Rates hit fundraising and cash distributions far more reliably than they hit the eventual multiple: a 1-point rate hike is tied to a $647 million drop in VC fundraising the following year, even as founder demand for VC money rises because bank debt just got pricier (European Financial Management Association (EFMA) working paper). That damage is showing now: distributions are running at 7.9% of net asset value (NAV), about half the long-run norm (PitchBook). | |||||
|
Bottom Line
| |||||
| |||||
|
The Honest Read
| |||||
| |||||
|
Where We’d Lean In
| |||||
|
› Keep pacing through the hike. Investors who pause when rates jump tend to miss the reset vintages that follow. › Early stage, outside the premium. Where non-AI founders face tougher terms, the discount is already on the table. › Seasoned assets through secondaries. Direct secondary trading reached an estimated $107.1 billion over the trailing 12 months (PitchBook). Seasoned portfolios bought below last-round marks are the closest thing to a reset vintage today. The Fed sets the clock. The entry price sets the score.
| |||||
| |||||
|
Next month: The Patience Premium. After a decade of near-zero rates, capital was cheap and waiting was easy. Now the ability to wait may be one of the most valuable advantages in markets. Who can afford it, and who cannot, could shape what gets built next. Coming up: The Overshoot. Every great buildout leaves something behind, and someone holding the bill. From railways to electricity to fiber-optic cable, the history of infrastructure booms shows who captures the lasting value, and who pays to create it. | |||||
| |||||
|
Fine Print
| |||||
|
Cambridge Associates’ “Late & Expansion Stage” is doing double duty as the “growth” category here. Nobody in institutional benchmarking uses a clean early/growth/late taxonomy across 45 years, and small sample sizes in that bucket (single-digit fund counts some years) mean the numbers wobble (Cambridge Associates). 2022-2023 IRRs are toddlers: funds that age are still marking up, marking down, and generally fibbing about their final numbers, so treat them as provisional (Cambridge Associates). All correlations are Pearson coefficients on 24-31 annual observations: directionally useful, and nothing to put in a pitch deck as gospel. Rates on the vintage map are approximate annual averages; its vertical placement is qualitative. Market figures as of early October 2026. | |||||
|
The Systematic Signal
Twice-monthly private-markets intelligence. The Systematic Signal is market intelligence for professional recipients. It is not an offer, solicitation, or recommendation to buy or sell any security. Figures are drawn from cited third-party sources; details on unclosed rounds are reported, not confirmed. © 2026 Systematic Ventures, 110 East 25th Street, New York, NY 10010.
| |||||
|
